
Use case · Sales
The weekly sales report, done before the meeting
Export the deals or orders, attach the file and ask. GPTExcel finds what moved, builds the pivot tables and charts, and can run the same report every Monday as a workflow.
See it work
Sales, start to finish
A replay of the real app on sample data. Pick a prompt and watch it answer.
Try a prompt
Click one to watch GPTExcel answer it.
Step 1
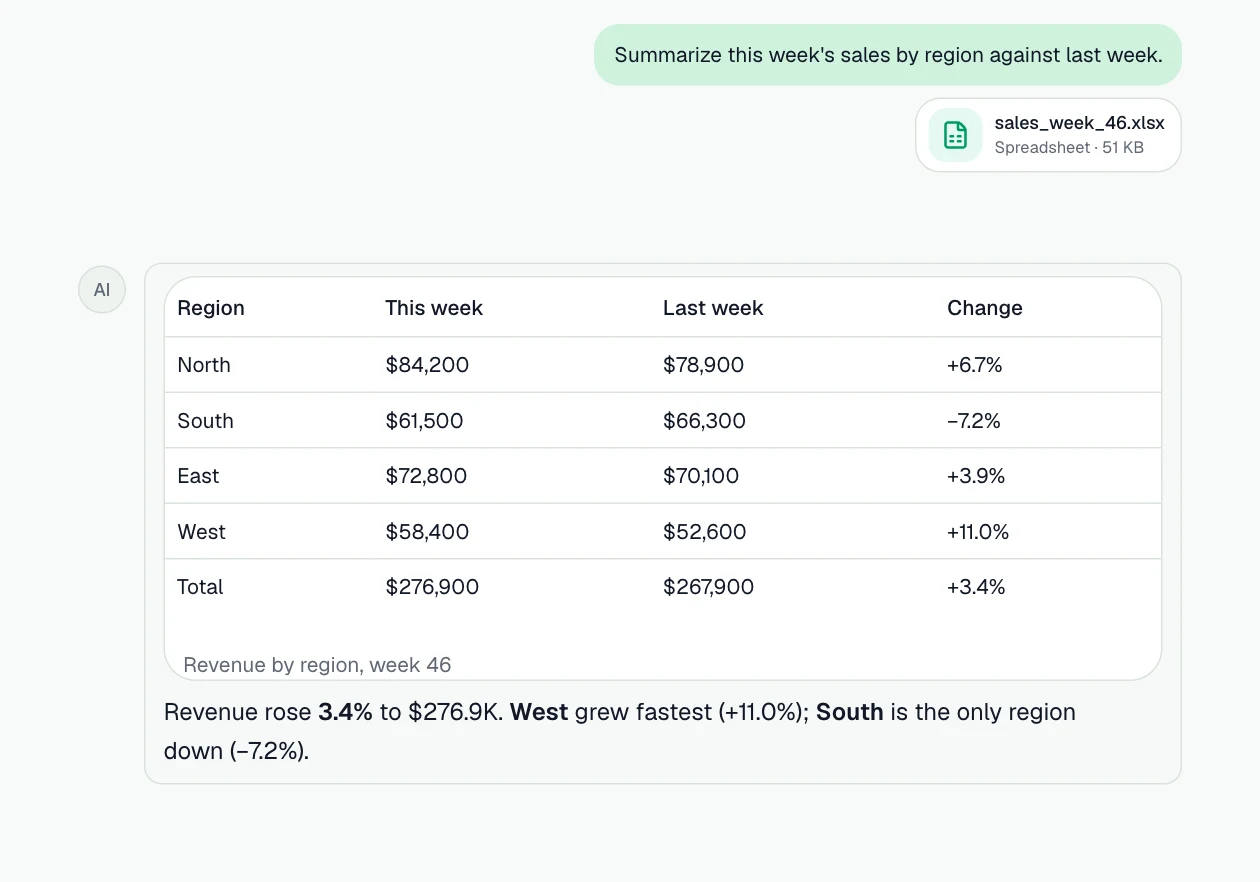
See what changed this week
Revenue by region against last week, and the reason in one line.
Prompt: “Summarize this week's sales by region against last week.”
Step 2
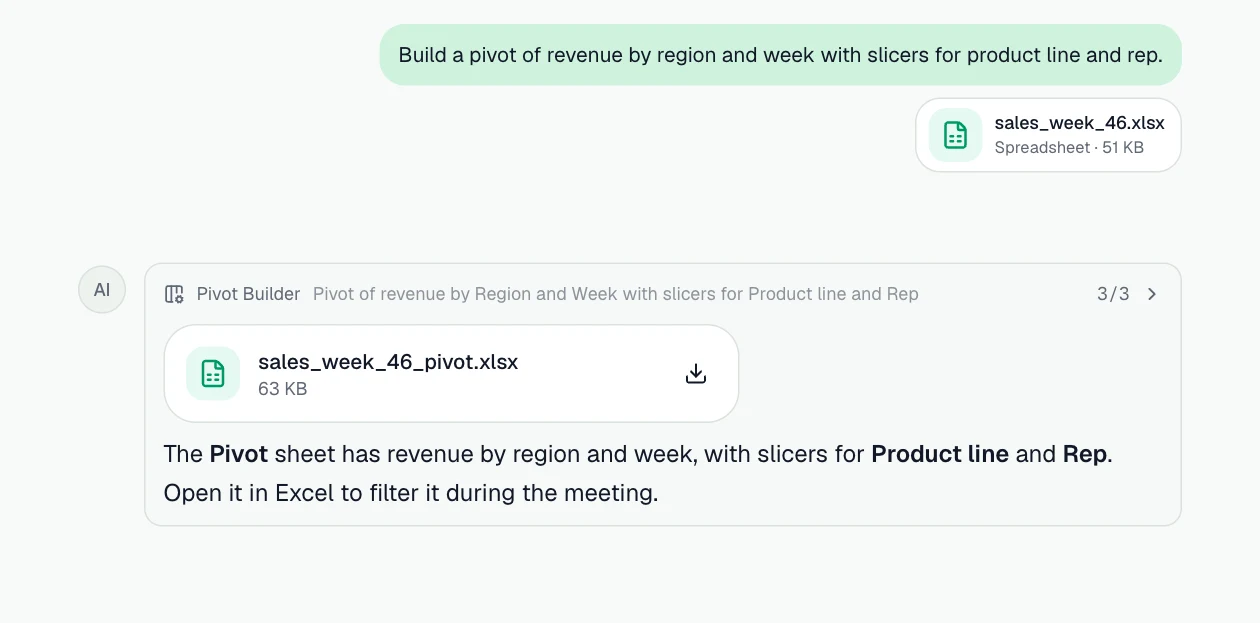
Build the pivot for the meeting
A native Excel pivot table with slicers, ready to filter live.
Prompt: “Build a pivot of revenue by region and week with slicers for product line and rep.”
Step 3
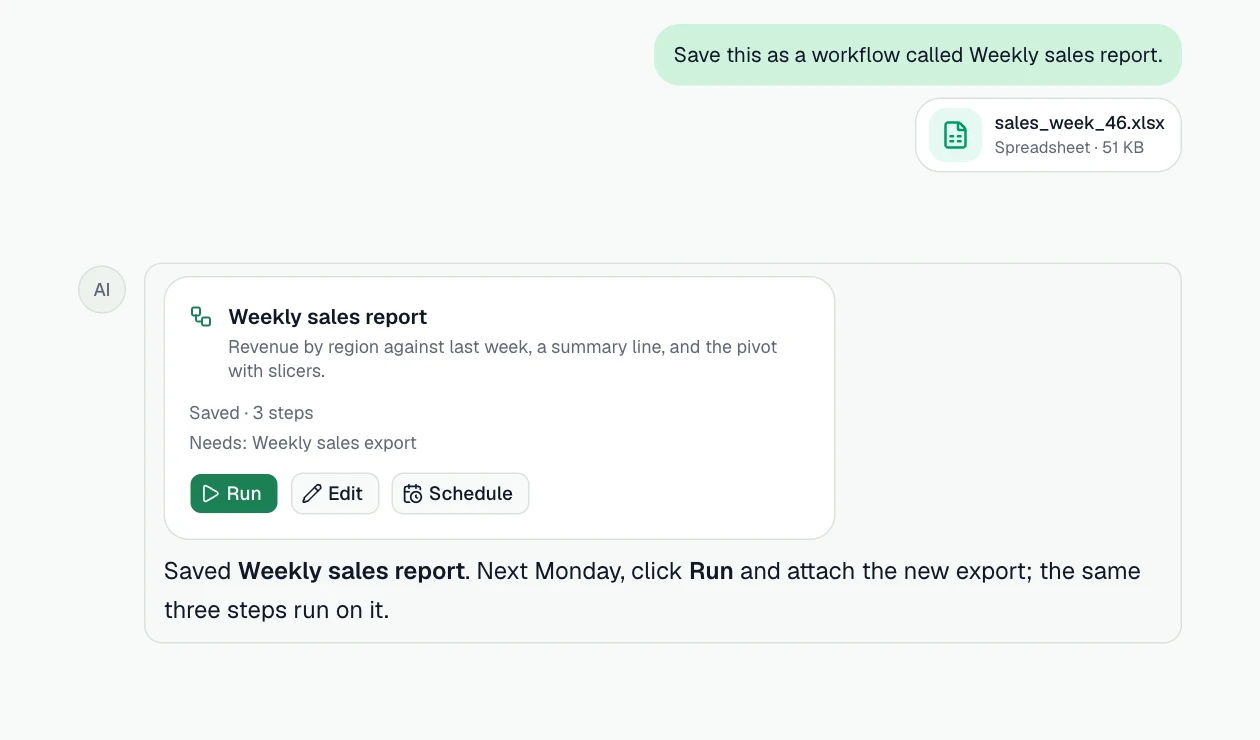
Run it again next Monday
Save the steps as a workflow and run them on next week's export.
Prompt: “Save this as a workflow called Weekly sales report.”
What you can do
More jobs it handles
Each one starts with a sentence like the one on its card.
What changed this week
Revenue, deals and average order value against last week and last year, with the reasons.
Example prompt: “Summarize this week's sales against last week. What drove the change?”
Top products and customers
Rank by revenue, margin or growth, and see who is slipping.
Example prompt: “Which 10 customers grew most this quarter, and which declined?”
Regional pivot with slicers
A native pivot table by region and month with slicers, ready to filter in the meeting.
Example prompt: “Build a pivot of revenue by region and month with slicers for product line and rep.”
Pipeline health
Stage conversion, deal age and the deals stuck longest in each stage.
Example prompt: “From this pipeline export, show conversion by stage and the 10 oldest open deals.”
Charts for the team
Trend lines and comparisons ready to paste into the update.
Example prompt: “Chart monthly revenue by region for this year.”
Same report, every Monday
Save it as a workflow and run it on next week's export in one click.
Example prompt: “Save this as a workflow called Weekly sales report.”
How it works
- Step 1
Bring the data
Attach Excel or CSV files, add them from Google Drive or OneDrive, or attach a connected PostgreSQL database.
- Step 2
Ask in plain English
Describe what you need. GPTExcel reads the data, runs the analysis and shows how it got each number.
- Step 3
Take the result with you
Download the workbook, pivot tables or slide deck, save it to your drive, or save the steps as a workflow.
The features behind it
Chat with your files
Ask about Excel, CSV and TSV files in plain English and get answers grounded in the data.
Pivot Builder
Native Excel pivot tables, slicers, timelines and pivot charts from one sentence.
Charts in the chat
Bar, line, area, scatter, pie, heatmap and radar charts drawn in the chat, and anything else through Python.
Workflows
Save a multi-step task once, then run it on next week's file, in the background or on a schedule.
Slide Deck Builder
Turn the analysis into a presentation with native charts, as PowerPoint or PDF.
Google Drive and OneDrive
Add files from your drive and save results back as a file or a Google Sheet.
Questions
- Can it work with my CRM data?
- Yes, through an export: most CRMs export deals and orders as CSV or Excel. If the data is in a PostgreSQL database, you can connect it directly.
- Are the pivot tables real Excel pivots?
- Yes. Pivot Builder creates native pivot tables, slicers, timelines and pivot charts that you can refresh and rearrange in Excel.
- Can the report run without me?
- Yes, once its input doesn't need you: keep the file with the workflow or point it at a team folder, then schedule it daily, weekly or monthly. Each run lands in a new chat with its result files. Schedules depend on your plan.