
Use case · Marketing
Know which campaigns pay for themselves
Combine ad platform exports, analytics data and sales in one chat. GPTExcel cleans the campaign names, joins the files, and shows cost per acquisition and return by channel.
See it work
Marketing, start to finish
A replay of the real app on sample data. Pick a prompt and watch it answer.
Try a prompt
Click one to watch GPTExcel answer it.
Step 1
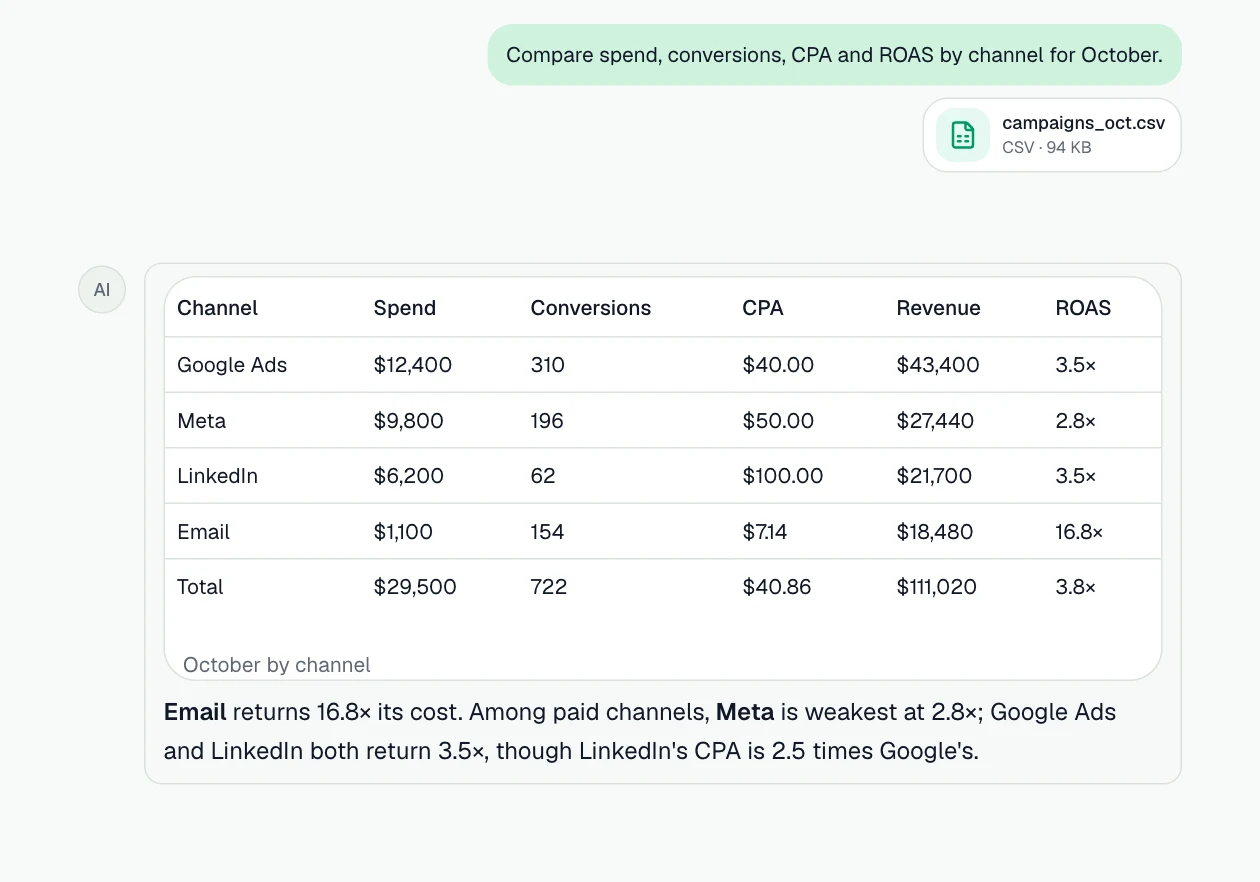
Return on spend by channel
Spend, conversions, cost per acquisition and ROAS side by side.
Prompt: “Compare spend, conversions, CPA and ROAS by channel for October.”
Step 2
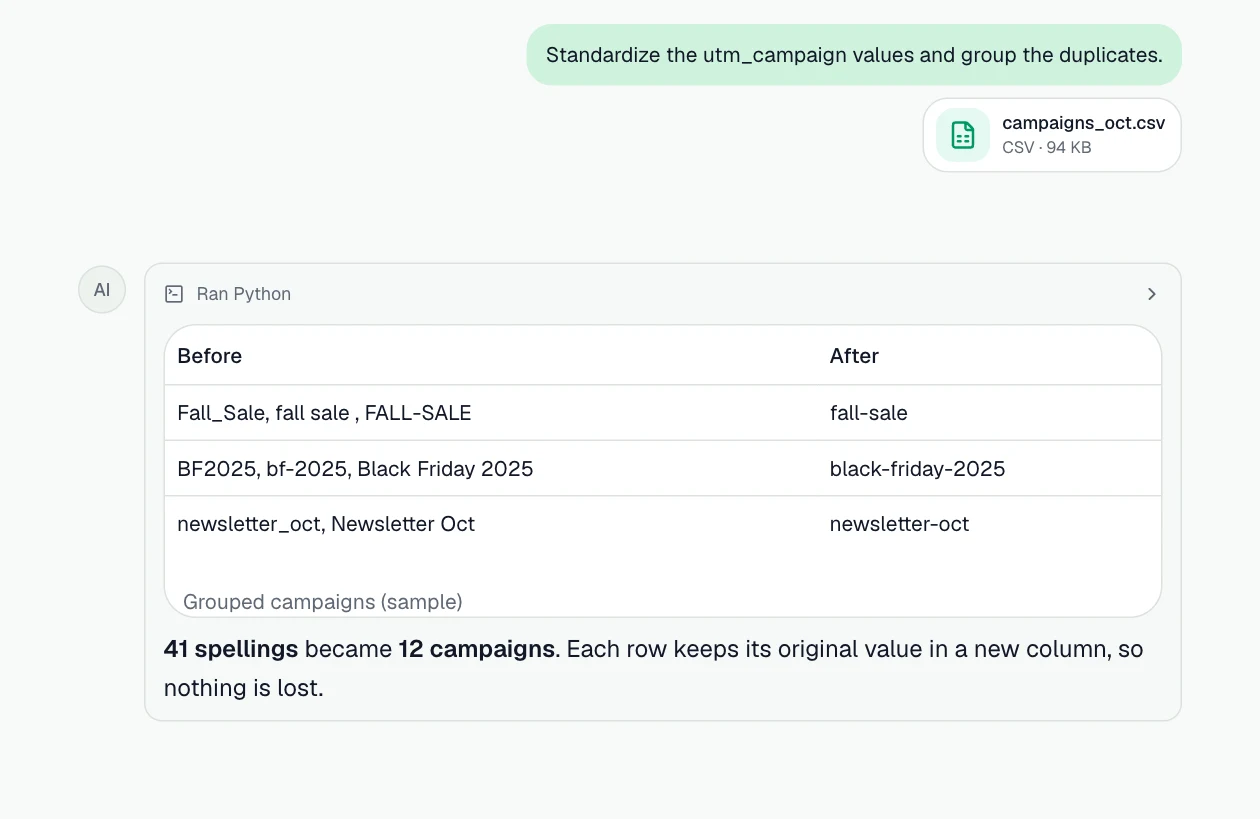
Clean up campaign names
Inconsistent UTM values grouped so the numbers add up.
Prompt: “Standardize the utm_campaign values and group the duplicates.”
Step 3
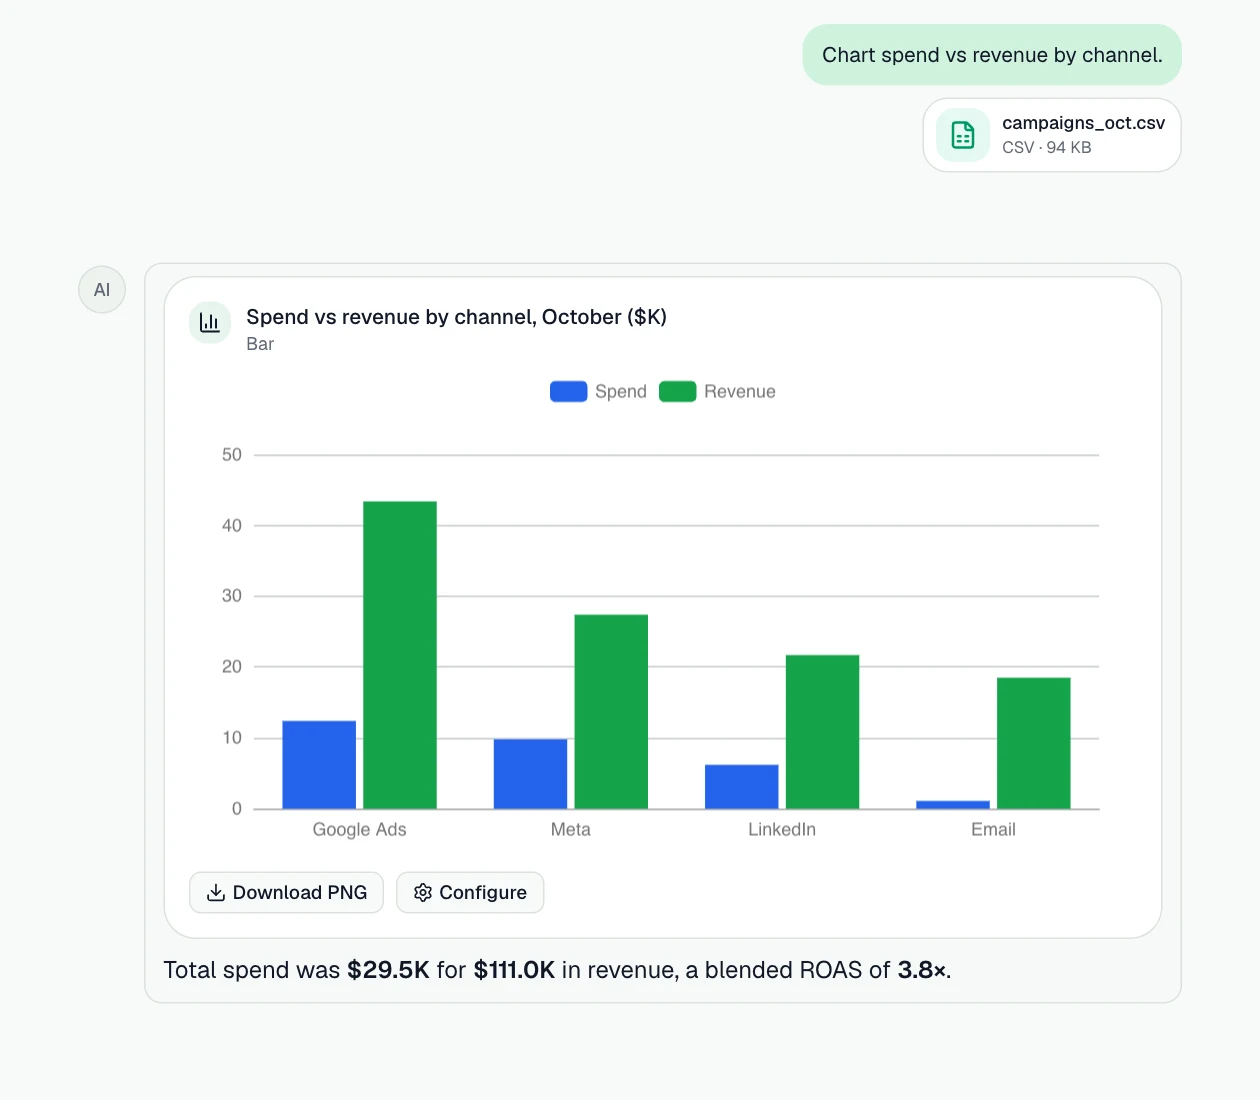
Chart it for the review
Spend against revenue by channel, ready for the monthly update.
Prompt: “Chart spend vs revenue by channel.”
What you can do
More jobs it handles
Each one starts with a sentence like the one on its card.
ROI by channel
Spend, conversions, cost per acquisition and return for every channel side by side.
Example prompt: “Compare spend, conversions, CPA and ROAS by channel for last month.”
Join several exports
Ads, analytics and CRM files matched by campaign or date into one table.
Example prompt: “Join the Google Ads and Meta exports with the sales file by campaign and date.”
Clean UTM and campaign names
Fix inconsistent spellings and casing so the numbers add up.
Example prompt: “Standardize the utm_campaign values and group the obvious duplicates.”
Funnel conversion
Where people drop off between visit, sign-up and purchase, by source.
Example prompt: “Show the funnel from visit to purchase by traffic source.”
Charts and a deck
Trend charts and a short deck for the monthly marketing review.
Example prompt: “Make a 5-slide deck of this month's campaign results with charts.”
Same report next month
Save the analysis as a workflow and run it on next month's exports.
Example prompt: “Save this as a workflow called Monthly campaign report.”
How it works
- Step 1
Bring the data
Attach Excel or CSV files, add them from Google Drive or OneDrive, or attach a connected PostgreSQL database.
- Step 2
Ask in plain English
Describe what you need. GPTExcel reads the data, runs the analysis and shows how it got each number.
- Step 3
Take the result with you
Download the workbook, pivot tables or slide deck, save it to your drive, or save the steps as a workflow.
The features behind it
Chat with your files
Ask about Excel, CSV and TSV files in plain English and get answers grounded in the data.
Charts in the chat
Bar, line, area, scatter, pie, heatmap and radar charts drawn in the chat, and anything else through Python.
Python in a sandbox
Cleaning, statistics and models run as real Python (pandas, SciPy, statsmodels, scikit-learn), and you can read the code.
Slide Deck Builder
Turn the analysis into a presentation with native charts, as PowerPoint or PDF.
Workflows
Save a multi-step task once, then run it on next week's file, in the background or on a schedule.
Google Drive and OneDrive
Add files from your drive and save results back as a file or a Google Sheet.
Questions
- Does it connect to Google Ads or Meta directly?
- No. Export the reports as CSV or Excel and attach them, or add them from Google Drive or OneDrive.
- Can it combine several files?
- Yes. Attach several files to one chat and ask GPTExcel to join or compare them.
- Can I get the results as a Google Sheet?
- Yes. Connect Google Drive and ask to save the result; it can be saved as a Google Sheet.