
Use case · HR and people
People analytics from one HR export
Attach the employee list and ask about headcount, attrition or pay. GPTExcel calculates the rates, compares departments and shows where pay is out of line.
See it work
HR analytics, start to finish
A replay of the real app on sample data. Pick a prompt and watch it answer.
Try a prompt
Click one to watch GPTExcel answer it.
Step 1
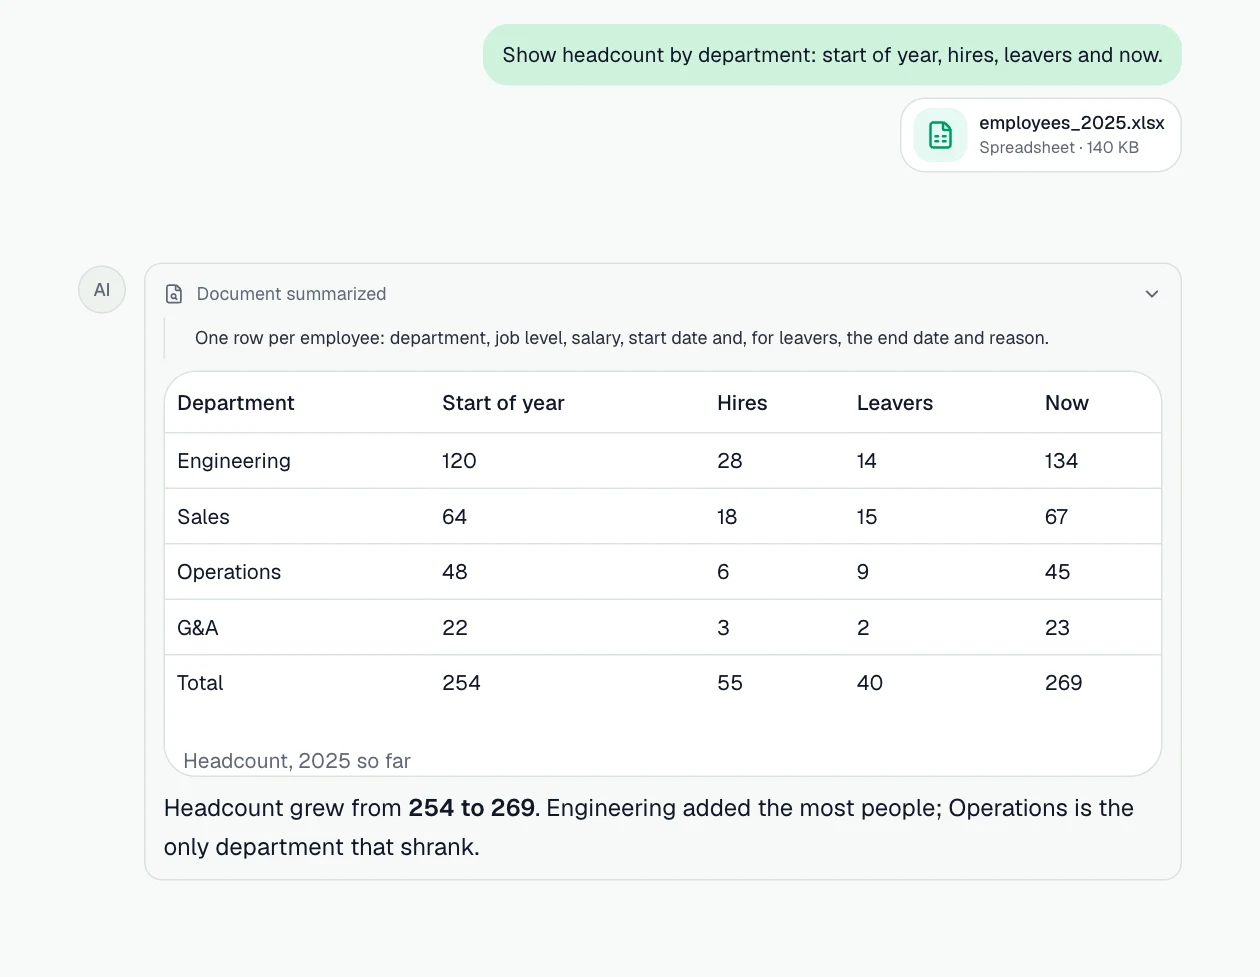
Headcount, hires and leavers
Where the company grew this year, department by department.
Prompt: “Show headcount by department: start of year, hires, leavers and now.”
Step 2
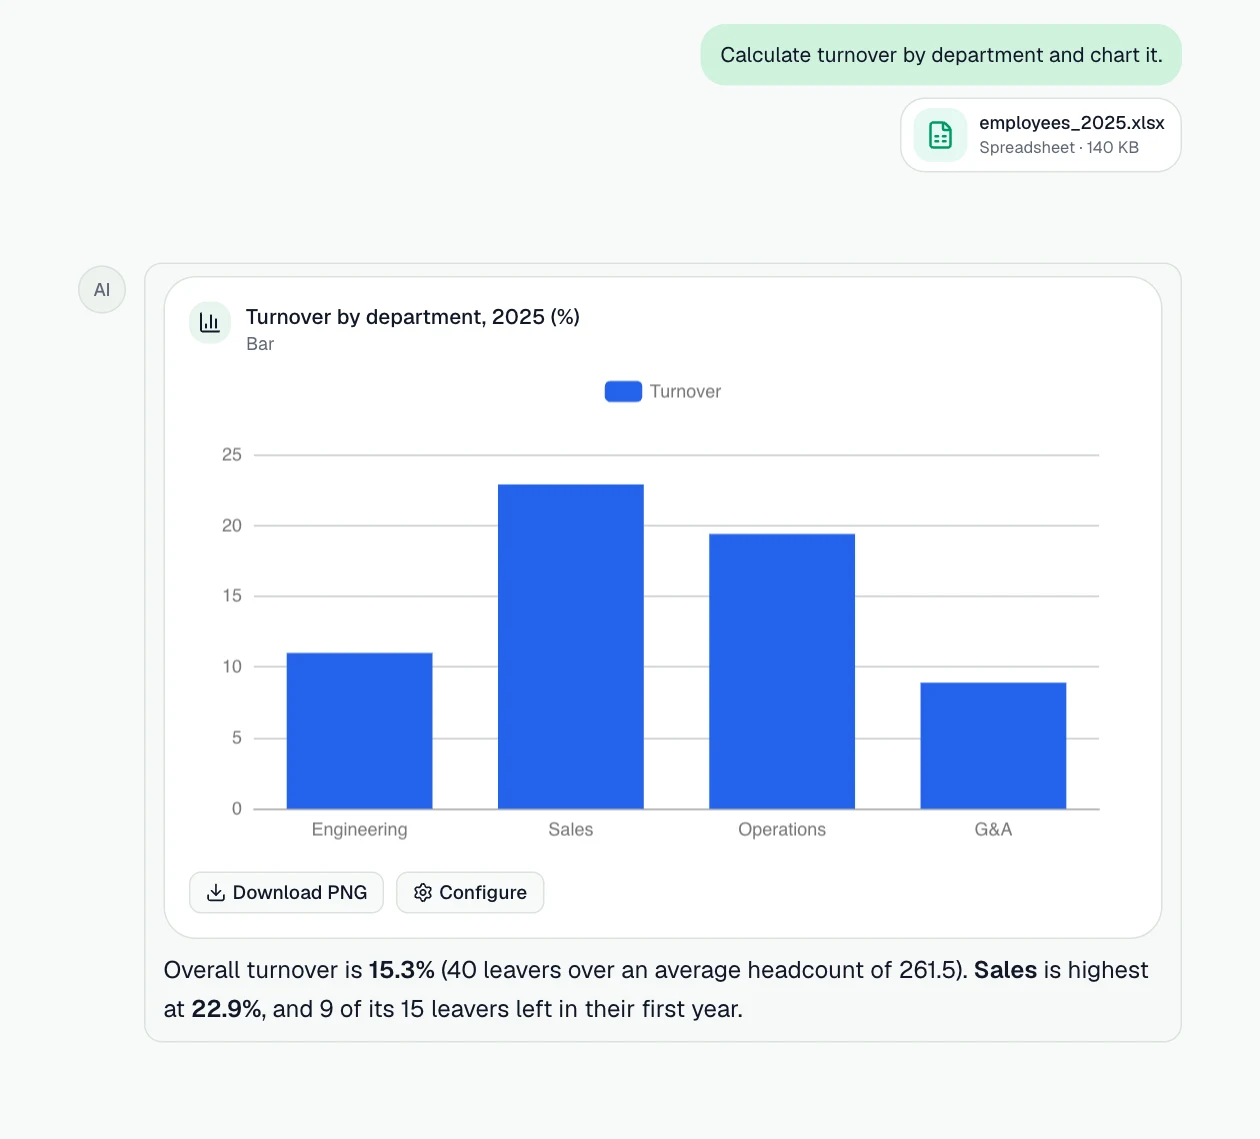
Turnover by department
Leavers against average headcount, and where people leave early.
Prompt: “Calculate turnover by department and chart it.”
Step 3
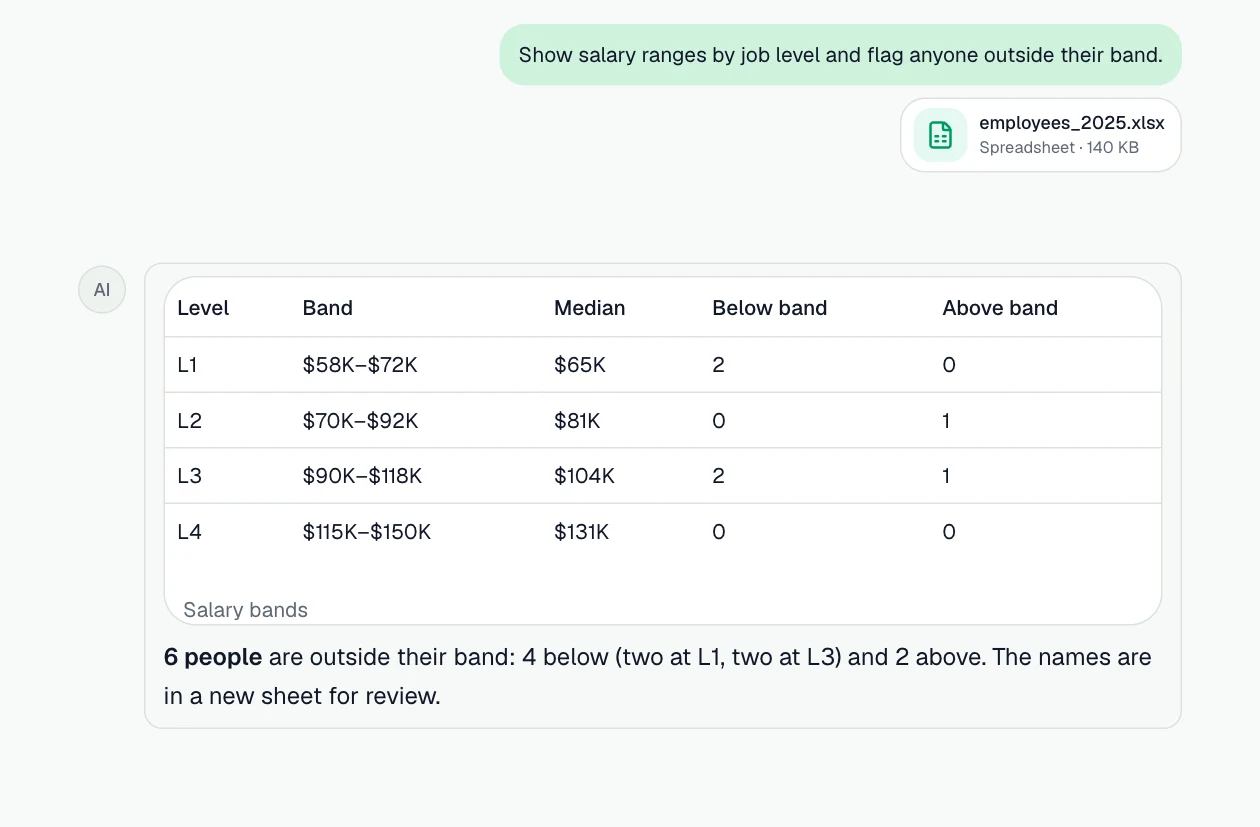
Check pay against bands
Salary ranges by level, and everyone outside their band.
Prompt: “Show salary ranges by job level and flag anyone outside their band.”
What you can do
More jobs it handles
Each one starts with a sentence like the one on its card.
Headcount over time
Hires, leavers and net change by month and department.
Example prompt: “Show headcount by department at the end of each month this year.”
Turnover and tenure
Annual and voluntary turnover, average tenure, and who leaves in the first year.
Example prompt: “Calculate turnover by department and the share of leavers with under 12 months' tenure.”
Salary bands and outliers
Pay ranges by role and level, and people outside their band.
Example prompt: “Show salary ranges by job level and flag anyone outside their band.”
Pay gap check
Median pay compared across groups within the same role and level.
Example prompt: “Compare median salary by gender within each job level.”
Leadership summary
A short deck of the key people metrics with charts.
Example prompt: “Make a 5-slide people metrics summary for the leadership meeting.”
How it works
- Step 1
Bring the data
Attach Excel or CSV files, add them from Google Drive or OneDrive, or attach a connected PostgreSQL database.
- Step 2
Ask in plain English
Describe what you need. GPTExcel reads the data, runs the analysis and shows how it got each number.
- Step 3
Take the result with you
Download the workbook, pivot tables or slide deck, save it to your drive, or save the steps as a workflow.
The features behind it
Chat with your files
Ask about Excel, CSV and TSV files in plain English and get answers grounded in the data.
Charts in the chat
Bar, line, area, scatter, pie, heatmap and radar charts drawn in the chat, and anything else through Python.
Pivot Builder
Native Excel pivot tables, slicers, timelines and pivot charts from one sentence.
Slide Deck Builder
Turn the analysis into a presentation with native charts, as PowerPoint or PDF.
Python in a sandbox
Cleaning, statistics and models run as real Python (pandas, SciPy, statsmodels, scikit-learn), and you can read the code.
Workflows
Save a multi-step task once, then run it on next week's file, in the background or on a schedule.
Questions
- Is employee data kept private?
- Your files are encrypted in transit and at rest, your chats are private unless you share a link, and nothing is used to train AI models. You can also remove names before uploading.
- Which HR systems does it work with?
- Any system that exports to Excel or CSV. GPTExcel works on the export, not the system itself.