
Use case · Finance and FP&A
Financial analysis in plain English
Drop in the ledger export or the budget workbook and ask what changed and why. GPTExcel finds the variances, builds the pivot tables and charts, and turns the result into a deck for the review meeting.
See it work
Financial analysis, start to finish
A replay of the real app on sample data. Pick a prompt and watch it answer.
Try a prompt
Click one to watch GPTExcel answer it.
Step 1
Budget vs actual in one question
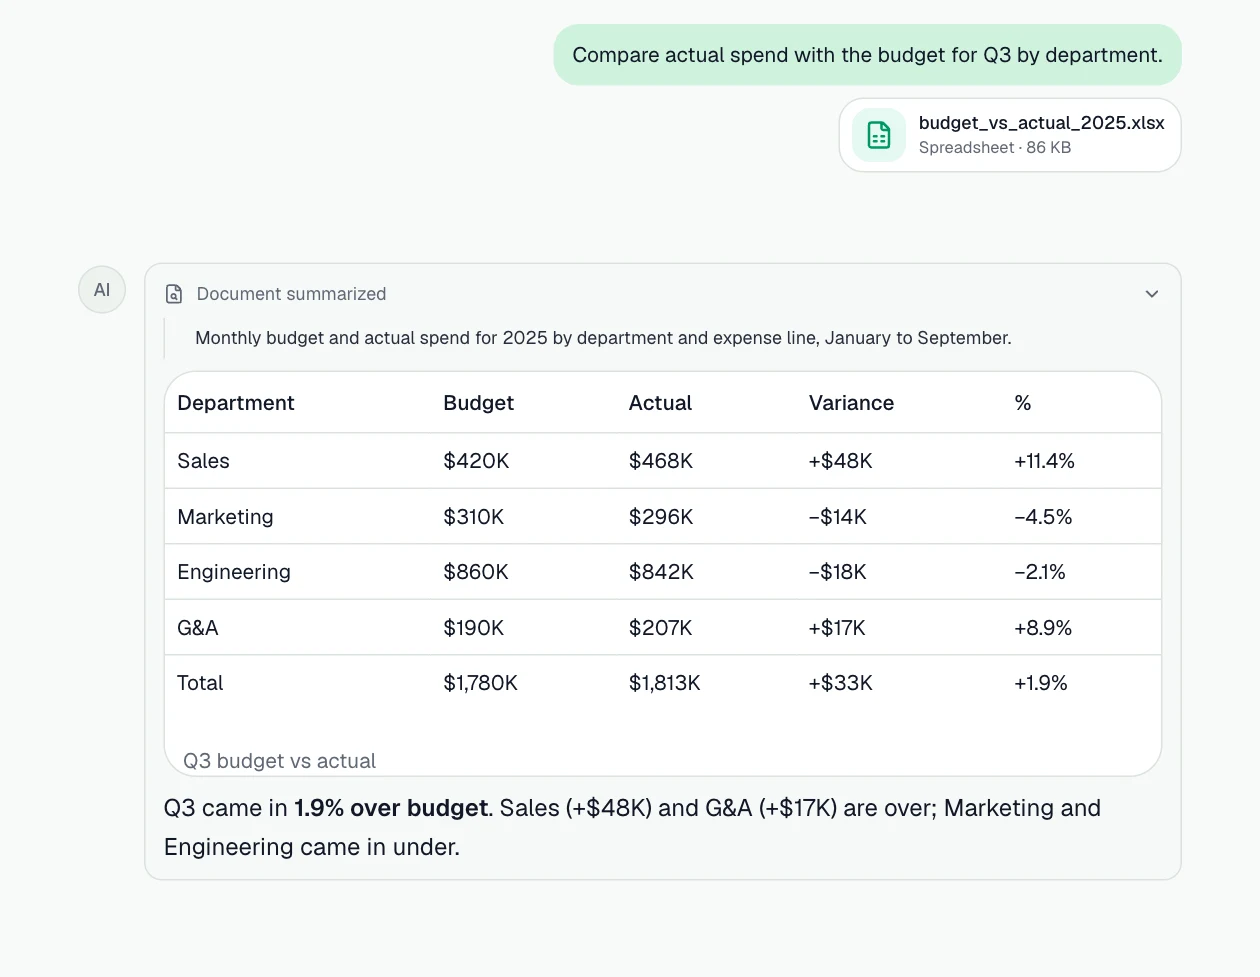
Spend against budget by department, with the variance in dollars and percent.
Prompt: “Compare actual spend with the budget for Q3 by department.”
Step 2
Find what drove the variance
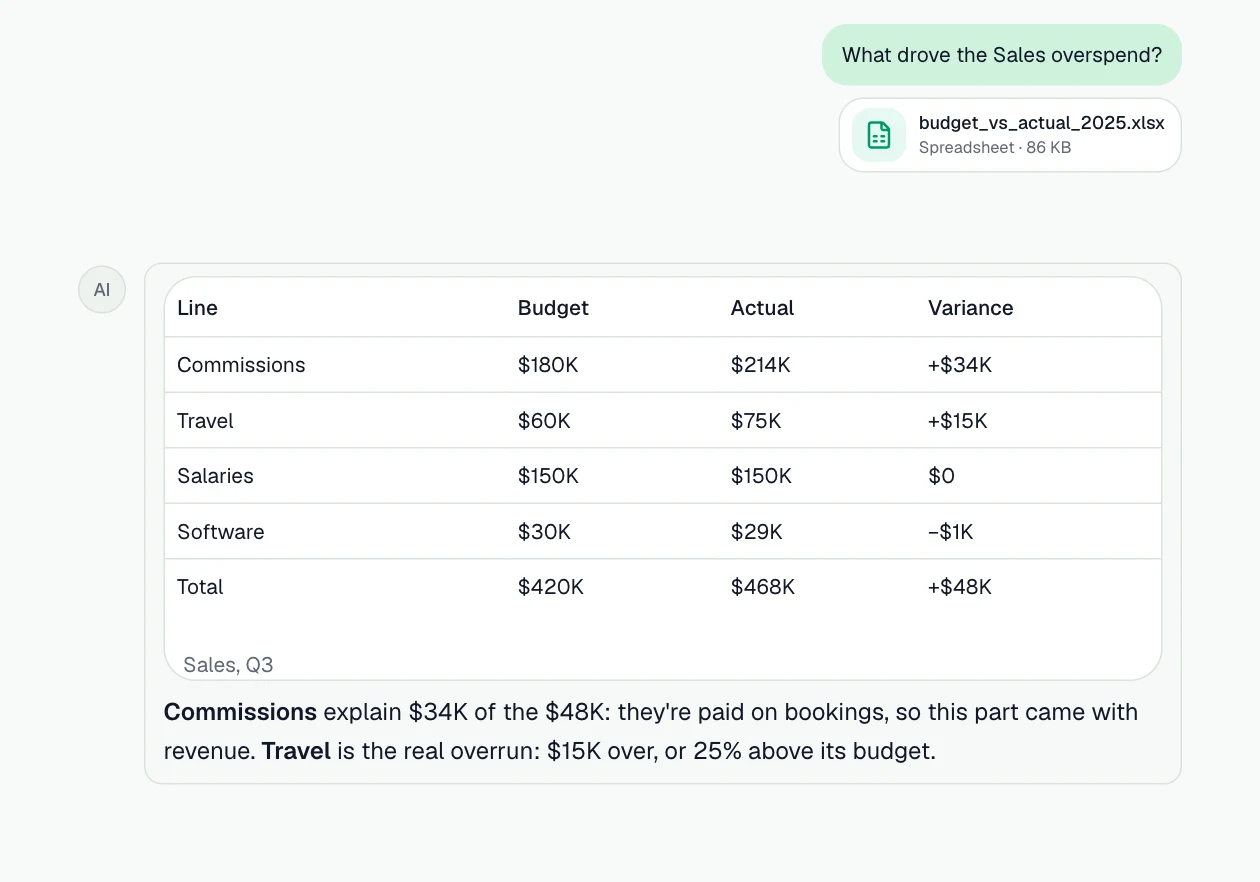
Break a department's overspend down to the lines that caused it.
Prompt: “What drove the Sales overspend?”
Step 3
Chart the trend and project ahead
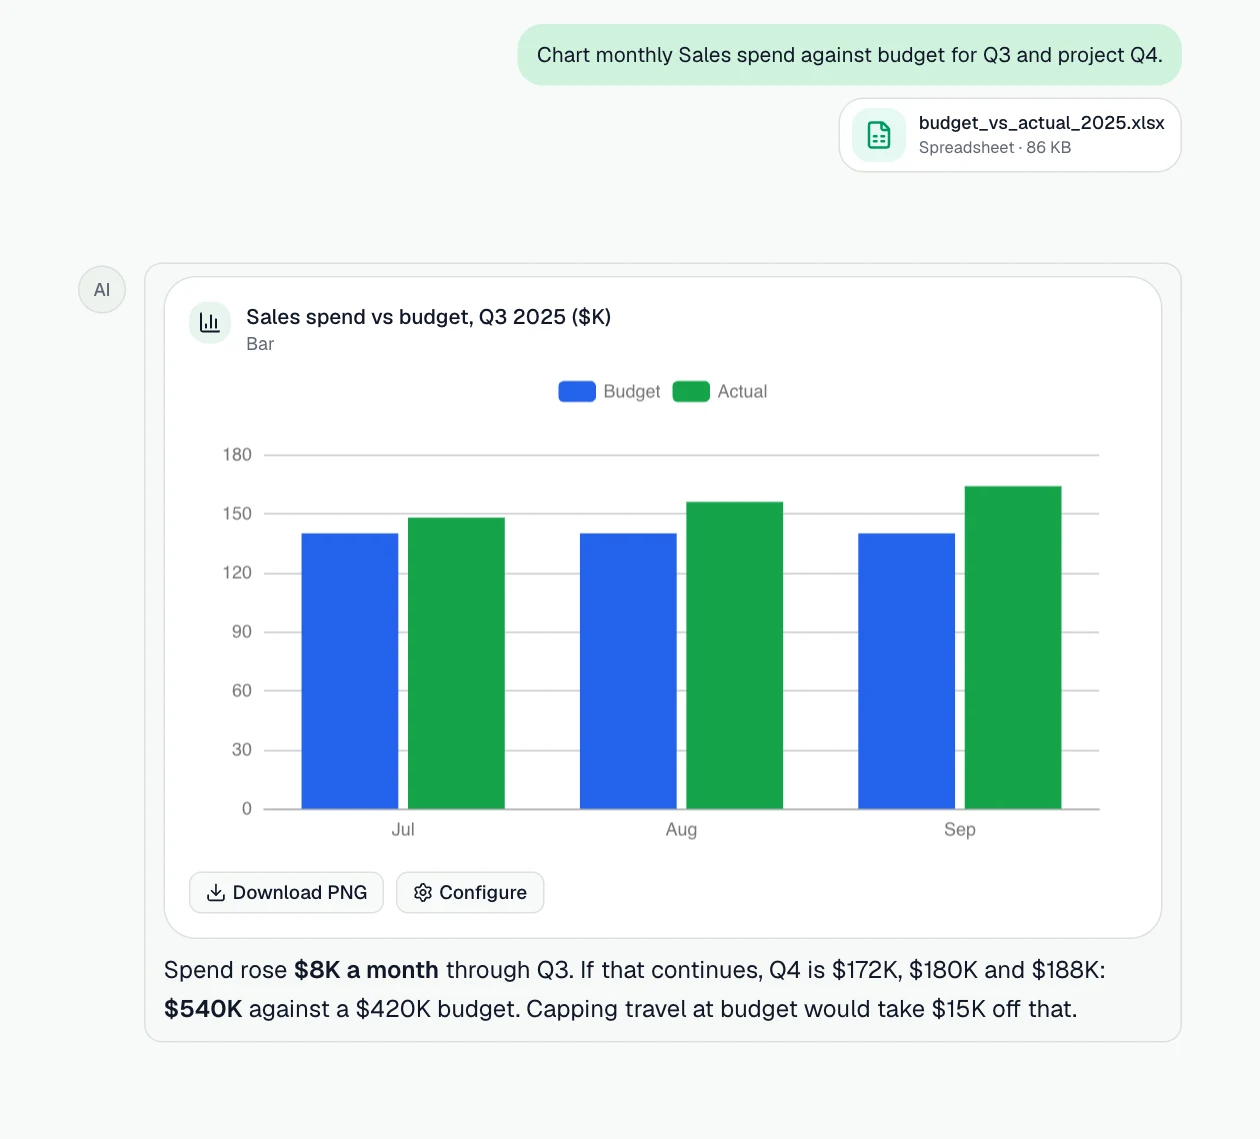
Monthly actual against budget, and where Q4 lands if the trend holds.
Prompt: “Chart monthly Sales spend against budget for Q3 and project Q4.”
What you can do
More jobs it handles
Each one starts with a sentence like the one on its card.
Budget vs actual
Compare spend against budget by category and month, and see where the overspend started.
Example prompt: “Compare actual spend with the budget by category and month. Which categories are over, and since when?”
Explain a variance
Break a change down by driver: price, volume, customer, region or vendor.
Example prompt: “Revenue is down 8% on last quarter. Break the change down by region and product.”
Forecast the next quarter
Trend-based projections with the assumptions written out, as a new sheet you can edit.
Example prompt: “Forecast the next three months of expenses from this history and list the assumptions.”
Pivot the P&L
Native Excel pivot tables with slicers for period and department, ready to refresh.
Example prompt: “Build a pivot of the P&L by department and month with a slicer for year.”
Make the board deck
A slide deck with native charts from the numbers, as PowerPoint or PDF.
Example prompt: “Turn this analysis into a 6-slide deck for the quarterly review.”
Run the monthly close pack every month
Save the steps as a workflow and run it on next month's export, or schedule it.
Example prompt: “Save what we just did as a workflow called Monthly variance pack.”
How it works
- Step 1
Bring the data
Attach Excel or CSV files, add them from Google Drive or OneDrive, or attach a connected PostgreSQL database.
- Step 2
Ask in plain English
Describe what you need. GPTExcel reads the data, runs the analysis and shows how it got each number.
- Step 3
Take the result with you
Download the workbook, pivot tables or slide deck, save it to your drive, or save the steps as a workflow.
The features behind it
Chat with your files
Ask about Excel, CSV and TSV files in plain English and get answers grounded in the data.
Pivot Builder
Native Excel pivot tables, slicers, timelines and pivot charts from one sentence.
Slide Deck Builder
Turn the analysis into a presentation with native charts, as PowerPoint or PDF.
Formulas you can reuse
Get the Excel or Google Sheets formula behind an answer, explained step by step.
Workflows
Save a multi-step task once, then run it on next week's file, in the background or on a schedule.
Google Drive and OneDrive
Add files from your drive and save results back as a file or a Google Sheet.
Questions
- Does it work with exports from my accounting software?
- Yes, if you can export to Excel (.xlsx, .xls, .xlsb) or CSV. GPTExcel reads every sheet and can clean up headers, dates and amounts before the analysis.
- Can I check how a number was calculated?
- Yes. Ask for the formula behind any figure, or open the Python step to see exactly what was computed.
- Can it produce a file I can keep working on?
- Yes. Results come back as Excel workbooks with real formulas and pivot tables, and decks download as editable PowerPoint files.