
Use case · Operations
Operational reports that run themselves
Ask about stock levels, lead times or late orders from a spreadsheet or straight from your PostgreSQL database. Save a spreadsheet report as a workflow, and on a team plan have it run every morning on the newest file in a team folder.
See it work
Operations, start to finish
A replay of the real app on sample data. Pick a prompt and watch it answer.
Try a prompt
Click one to watch GPTExcel answer it.
Step 1
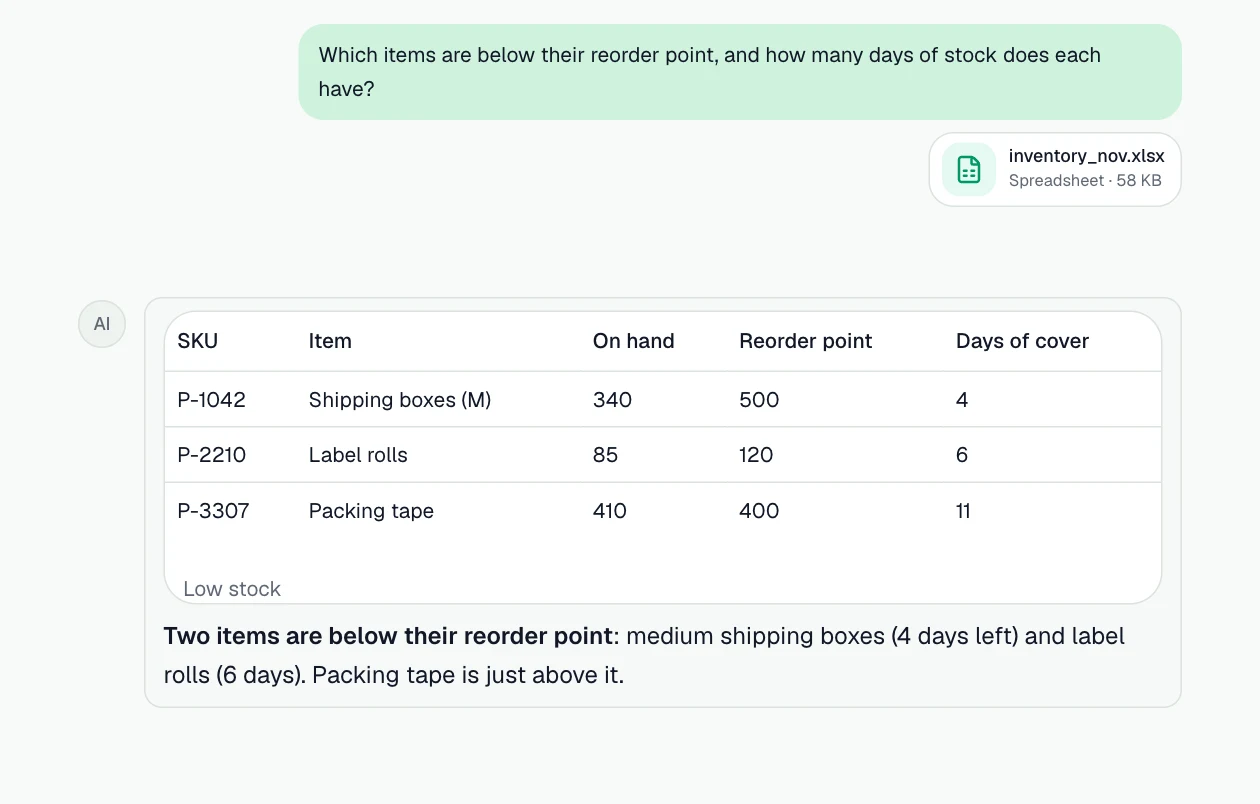
Spot stock that's running out
Items below their reorder point, and days of cover for the rest.
Prompt: “Which items are below their reorder point, and how many days of stock does each have?”
Step 2
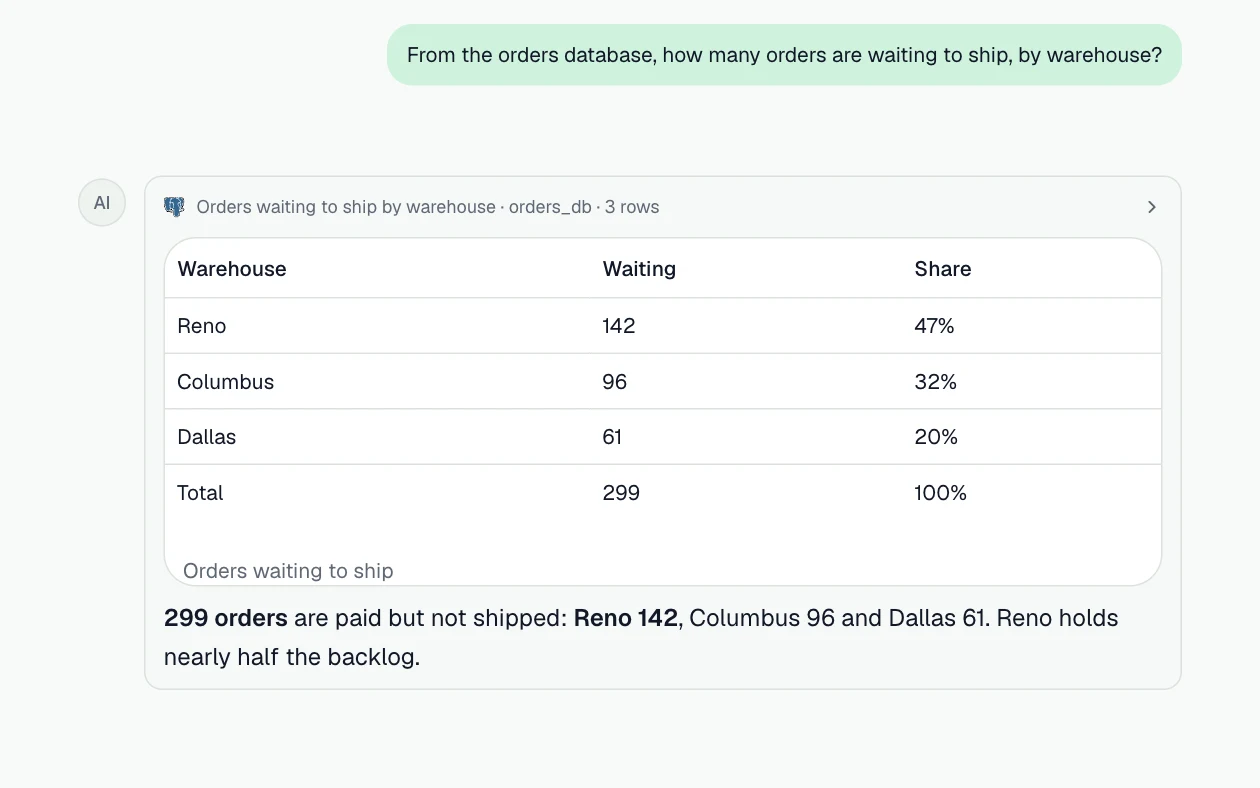
Ask the orders database
Live numbers from PostgreSQL, read-only, with the SQL shown.
Prompt: “From the orders database, how many orders are waiting to ship, by warehouse?”
Step 3
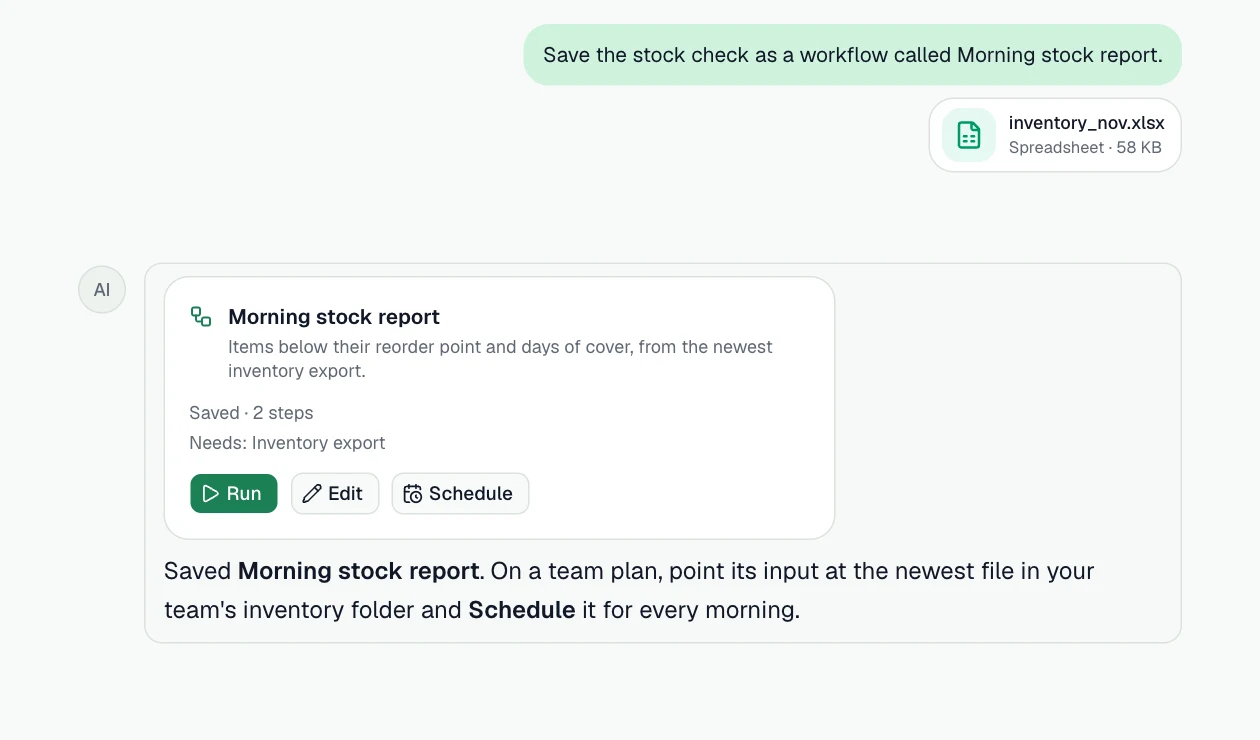
Make it a morning report
Save the stock check as a workflow that can run on a schedule.
Prompt: “Save the stock check as a workflow called Morning stock report.”
What you can do
More jobs it handles
Each one starts with a sentence like the one on its card.
Stock and reorder points
Items below their reorder point, days of cover and what to order.
Example prompt: “Which items are below their reorder point, and how many days of stock do the rest have?”
On-time delivery
Late orders by carrier, route or supplier, and how late.
Example prompt: “Show on-time delivery rate by carrier for the last 8 weeks.”
Live numbers from Postgres
Ask your operational database directly. Read-only, and only the tables you choose.
Example prompt: “From the orders database, how many orders are waiting to ship, by warehouse?”
KPI dashboard workbook
One workbook with the KPIs, pivots and charts the team checks every week.
Example prompt: “Build a KPI workbook with weekly throughput, backlog and average lead time.”
Morning report on a schedule
Save it as a workflow and schedule it daily at a set time in your time zone, with a notification if a run fails.
Example prompt: “Save this as a workflow called Morning ops report.”
How it works
- Step 1
Bring the data
Attach Excel or CSV files, add them from Google Drive or OneDrive, or attach a connected PostgreSQL database.
- Step 2
Ask in plain English
Describe what you need. GPTExcel reads the data, runs the analysis and shows how it got each number.
- Step 3
Take the result with you
Download the workbook, pivot tables or slide deck, save it to your drive, or save the steps as a workflow.
The features behind it
Workflows
Save a multi-step task once, then run it on next week's file, in the background or on a schedule.
PostgreSQL databases
Ask questions of Postgres, Supabase or Neon. Read-only, only the tables you choose.
Chat with your files
Ask about Excel, CSV and TSV files in plain English and get answers grounded in the data.
Pivot Builder
Native Excel pivot tables, slicers, timelines and pivot charts from one sentence.
Charts in the chat
Bar, line, area, scatter, pie, heatmap and radar charts drawn in the chat, and anything else through Python.
Google Drive and OneDrive
Add files from your drive and save results back as a file or a Google Sheet.
Questions
- Can I ask my database without writing SQL?
- Yes. Connect PostgreSQL (including Supabase and Neon) in Settings, attach it to a chat and ask in plain English. GPTExcel writes the SQL, runs it read-only on the tables you chose, and shows the query it ran.
- What happens if a scheduled run fails?
- You get a notification in the app, and the run's details show which step failed. After three failed runs in a row the schedule pauses itself.